Monday, April 15, 2013

Look! I can see my qvw from here.


Our friends over at Vizubi, famous for their great NPrinting product, have created a neat little plugin called QlikLook.


Have you ever said to yourself, “Where is that qvw that I did <blank> in?”   Which qvw had that trick for establishing a closed hierarchy?  Where was that expression with the crazy set analysis in it?  Which qvw has that great mini-chart example?  Which qvw out of the 200 scattered throughout my local drive is the one that I am looking for?

QlikLook allows you to preview any QlikView document (qvw) in an Outlook or Windows Explorer preview pane.


In addition, you can browse the sheets and make selections in the preview pane.  Basically you can use it as if you are using the document in a browser from the access point.

You can find the application here .  IT IS FREE.  You will be identified through LinkedIn, thus allowing you to download the executable and license.  The install is straight forward.

Now, if you enable your preview pane in Outlook (in the View menu) and then select an email that has a qvw attachment, the preview pane will fill with the sheets in that qvw.  For Windows Explorer, the preview pane is turned off by default.  To turn it on go to Organize à Layout à and enable Preview Pane. 

Although there is some lag depending on the size of the document, it seems to respond very well and has helped me scan through documents without opening QlikView (or yet another instance of it).

This is an incredibly convenient and useful tool.  I would encourage everyone to check it out.

Monday, April 1, 2013

My Help Sheet Needs Some Help


The poor help sheet.  It never gets any attention.  Yet, it is an incredibly important piece of your user experience that should not be overlooked.  Many of us have copy/pasted/adjusted derivatives of this:


Now this is a very old example straight from the QlikView Demo site, but I have used something similar to this for too long, choosing to spend my attention on the other aspects of my design.


The old-school help sheet suffers from several issues. 

First, the browser-agnostic environment of today has brought in issues off differing treatment of alignments and kerning.  So, if we use a traditional layering of icon text objects on top of text objects with paragraphs of text, you will get differing results depending on the browser being used.  Here is an example of a sheet I used that was viewed later in Google Chrome:


Secondly, I have found that the copy/paste method is not scalable.  When the product features change, it would be better to manage the help descriptions and icons from a central location that could then be dispersed to all my apps.

Lastly, many environments still use both the AJAX and the IE Plugin client.  This creates yet another issue in that the menu icons look completely different for each client.  It sure would be convenient if we could tell which client is being used and then display the appropriate icon set.

I have handled these issues for my own development, so I thought I would share J


Help Template

You can find the template and the files I am using to populate it here: help_template_repository.zip

The solution consists of first cropping pictures of all the different icons you wish to use in your help sheet.  This was completed with an example document opened first in AJAX and then with the IEPlugin so I could get all the possible icons. 

Then, a spreadsheet was created to house the names of all the pictures, id, client, category and description.  I also created another worksheet to house my larger chunks of text that would be shown in the help sheet.

Store all of this where your QVWs can reference it. 

Then I had to handle the loading of this.  I chose to create a txt file that I could manage outside of QlikView that could be referenced with an include statement:

$(Include=c:\qlikview documents\qv production documents\qlikview communal\include\help\help_bundle_load.txt);

Within the txt script, we first have to set variables with the paths of the icon repository and the spreadsheet.  I used the full UNC paths since QVWs using it might be scattered about the server.

SET vHelpDataPath = 'C:\QlikView Documents\QV Production Documents\QlikView Communal\Data\Help\Help_Text_Standard.xlsx';
SET vHelpIconPath = 'C:\QlikView Documents\QV Production Documents\QlikView Communal\Graphic\Help\';

Then we load the xls worksheets.  To get the actual pictures loaded into the QVW we use the BUNDLE LOAD.  This actually embeds the pictures into our documents.  Care should be taken with this function to ensure you are not loading a large number or large sized pictures as this would hinder performance.

BUNDLE INFO LOAD Picture_ID, '$(vHelpIconPath)' & [Picture_Name]
RESIDENT Help_Icons;

Lastly, we need to reference all of this data in our help sheet.  To load blocks of text, I created text objects with expressions like this:

=Minstring({<Help_ID = {2}>}Help_Text)

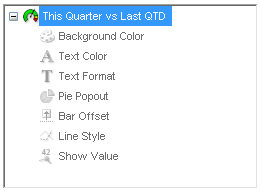
For the icons, I chose to create charts to display them, rather than trying to layer each one in between pieces of text.  You can create a chart with Picture_ID as the dimension, then Hide that column.  I then used two expressions, one to show the icon picture and one for the text descriptor. 

Notice the use of ClientPlatform().  This function will return nothing if the user is on the IEPlugin.  It will return the name of the browser if the user is on the AJAX client.  With this function, we can display only the appropriate set of icons to each user. 

The INFO function tells QlikView to display the embedded file associated with the field, rather than displaying the text.

Picture:

=IF(LEN(ClientPlatform())>0,
               
MINSTRING({<Picture_Category={'Selection'},Client_Type={'AJAX'}>}INFO(Picture_ID)),
               
MINSTRING({<Picture_Category={'Selection'},Client_Type={'IE'}>}INFO(Picture_ID)))

Text:

=IF(LEN(ClientPlatform())>0,
               
MINSTRING({<Picture_Category={'Selection'},Client_Type={'AJAX'}>}Picture_Text),
               
MINSTRING({<Picture_Category={'Selection'},Client_Type={'IE'}>}Picture_Text))

You will have to set the picture expression to Representation: Image and select “Keep Aspect” from the Image Formatting dropdown.


Final Result

I still manually create example charts and controls representative of my data to fill out the rest of the help sheet, but at least the main portions of my help sheet can be easily created and centrally managed. 

After adding the rest of my data model and the supporting charts, here is my finished product opened in AJAX and then with the IEPlugin:


I always welcome your comments and suggestions.


Sunday, September 2, 2012

Fine Tuning Your Objects - Dimension & Expression Attributes


Most of the time, clients simply care about getting their data.   And it is sometimes no small effort to transform business requirements (or lack thereof) into a working QlikView application.  Sometimes there is no room left in the budget for the finer design points. 

But many times, I find that going that extra mile to bring simple and intuitive meaning to the data can make the difference between QlikView being perceived as a lackluster business tool and the “lean forward experience” that we all want it to be (to use the words of Donald Farmer). 

Maybe we should highlight the new product line in our bar chart, or maybe we want to see the best and worst performers in a table or I want my forecast as a dotted line and my average trend to be a thinner line.

Now this kind of highlighting is not always intuitive in QlikView.  It took me a while to realize the power of these settings and I am still not at the point where I have memorized all the small syntax pieces needed to add these touches.  So I thought I would put together a small article to illustrate some examples and also to give myself and others an easy place to reference these codes.

The items we will cover are accessible in the dimensions and expressions tabs of your object properties.  If you expand the plus sign in your used dimensions or expressions, you will find the attributes we are discussing.  All these settings will require some form of calculated expression to work.  Also note that these settings will override any other display settings you have in the object.  We will examine these attributes in order.


Dimension Attributes
Dimension attributes only work in straight or pivot tables and will affect dimension columns.

Background Color and Text Color
These two attributes work the same way with one affecting the cell background and the other affecting the font color.  In this case, we want to highlight our new product line:

Background Color:
=IF(Product='Bazinga',RGB(100,100,100))

Text Color:
=IF(Product='Bazinga',White()) 


Text Format
The Marketing Director likes that but wants to go  a step further by displaying the text in bold italics.  No problem:

Text Format:
=IF(Product='Bazinga','<I><B>')


Note that you can use the following text formats and also that you can use more than one at a time like in our above example.
=’<B>’
Bold
=’<I>’
Italics
=’<U>’
Underline


Expression Attributes
Expression attributes are available in some capacities for all chart types.  These attributes affect the expression columns of a chart.

Background Color, Text Color and Text Format
Just like in the dimension attributes, Background and Text color change the colors of values in the data.  Text color only has an effect on straight or pivot tables.  Background color is adjustable for tables, and several other charts.  First, let’s adjust our straight table example again.  This time we want to highlight the cells that represent the best and worst performers in their expression columns.  We will also adjust the text format:

Background Color:
=IF(RANK(SUM({<IsForecast={0}>}Qty))=1,LightGreen(),
               
IF(RANK(-SUM({<IsForecast={0}>}Qty))=1,Red()))

Text Color:
=IF(RANK(-SUM({<IsForecast={0}>}Qty))=1,White())

Text Format:
=IF(RANK(SUM({<IsForecast={0}>}Qty))=1,'<B>')


Now let’s look at a bar chart.  We will go back to our previous example of highlighting the value that is our featured product type.  This is done with the Background Color attribute:


Background Color:
=IF(Product='Bazinga',RGB(0,255,0))


Pie Popout
The Pie Popout attribute is obviously only available when using a pie chart.  This will advance one slice of the pie slightly out from the center.  Let’s highlight our chosen product line.

Pie Popout:
Product='Bazinga'


Bar Offset
This attribute, when used in a bar chart, will raise a bar off the x-axis by a calculated amount.  This could be useful to create gaant charts.  For lack of a better example, we will stack each year’s sales on top of the previous total.

I first created an invisible expression called RunningTtl:
IF(RowNo()=1,SUM(Sales),
               
ABOVE(RunningTtl)+SUM(Sales))
Then I created this expression in the Bar Offset attribute:
IF(RowNo()=1,SUM(Sales),
               
ABOVE(RunningTtl)+SUM(Sales))-SUM(Sales)


Line Style and Show Value
These attributes are for use in line charts (or combo charts with line expressions).  The Line Style attribute changes the line to dotted, for example.  Show Value will allow us to selectively choose which points have a textual representation.  As stated before, these attribute settings will override any higher level configurations.  This time, we would like the sales figures to be represented by a continuous line (default) and the forecast to be displayed as a dotted line.  We also have a request to label the current year’s sales with text.  In addition, we want an average line that is very thin compared to the sales line:

Line Style (continuous vs. dotted):
=IF(IsForecast=1,'<S3>')

Show Value:
Year=Year(Today())

Line Style (width):
='<W.5>'


Line Style – Type
Description
=’<S1>’
Continuous
=’<S2>’
Dashed
=’<S3>’
Dotted
=’<S4>’
Dotted & Dashed

Line Style – Width
Description
=’<Wn>’
n = .5 – 8 to determine width of the line.


I am sure there are many more compelling uses for these attributes.  I believe they can add tremendous value in your visualizations as long as they are used for valid reasons.  Take your applications to the next level.